How fast is nothing at all ?
Running and measuring no-op code in a requestAnimationFrame()
One of the fastest functions that can be run inside requestAnimationFrame goes something like this:
function fastest() {
  window.requestAnimationFrame(fastest);
}
window.requestAnimationFrame(fastest);
A simple no-op. It does nothing besides requesting to be called in another frame in order to do nothing besides requesting to be called in another frame, and so on. A request for nothing that hopefully matches the speed of your monitor v-sync to hastily do just nothing.
Which gives us the perfect chance to use the most important skill we have in our life.
Giving meaning to nothing
Measuring the function can be done by placing marks and then collecting them with the performance.measure() function. To avoid placing a mark every frame lets also count them and place it only once every 120 frames. My monitor updates at about 60Hz so this should place a mark every 2 seconds.
let count = 0;
// ^ count each frame
function fastest() {
  window.requestAnimationFrame(fastest);
  count += 1;
  if(count === 120) {
    performance.mark("120");
    // ^ place a mark in the 120th
 }
}
performance.mark("0");
// ^ place a mark before the first frame
window.requestAnimationFrame(fastest);
window.setTimeout(function() {
  // measure the duration between those two marks;
  performance.measure("120frames", "0", "120");
  const measure = performance.getEntriesByType("measure")[0];
  console.log("120 frames in: " + measure.duration);
}, 3000);
At 60fps we get around 16.7ms per frame, 120 frames should run in ~2000ms. Yet after 3 seconds this code prints "120 frames in: 2148.415" in the console. This is 8% slower, making it closer to 55fps (18.2ms) than to 60fps(16.7ms).
If you thrive in the eccentricities of speed then those 1.5ms are simply unacceptable, lets try to understand what is happening by opening the "Performance" tab in the developer tools.
The eyes are the window of the soul. And all i see is garbage.
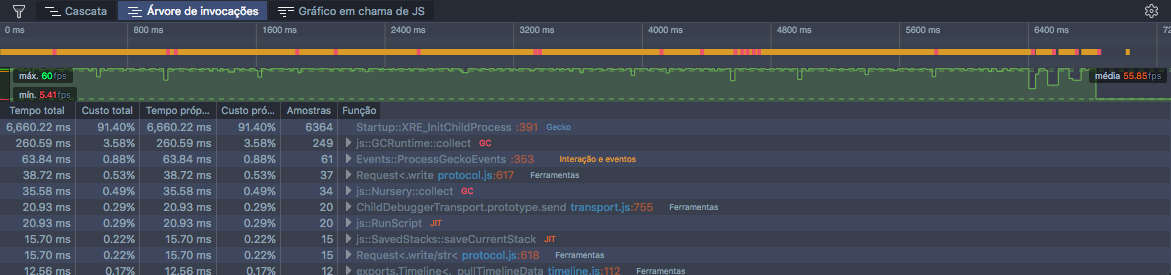
Those big drops in performance are related to the red dots of the Garbage Collector (from here on, just "GC"). They mark the time where GC woke up and run through the nursery of temporary objects to clean them.
These GC actions happen at the rate that the code fills the nursery heap with temporary objects. The browser then performs a small cleanup on the nursery heap and checks if some of those temporary objects can be promoted to the tenured heap.
The Tenured heap fills at a much lower rate than the Nursery and consequently the browser does not check it as often as the Nursery.
Lets try to promote all our short lived objects into something that might be selected to be tenured by the browser, thus reducing the time that the GC spends analyzing our running code and the nursery heap.
The execution context is dead. Long live the execution context!
My first approach is to remove the first invocation to the requestAnimationFrame() and place it inside a global closure in IIFE style.
let count = 0;
(function() {
  function fastest() {
    window.requestAnimationFrame(fastest);
    count += 1;
    if(count === 120) {
      performance.mark("120");
    }
  }
  performance.mark("0");
  fastest();
  // ^ call the function directly for the first frame
})();
// ^ IIFE
The idea here is to make the reference to the fastest() function explicitly last for the whole execution of the animation loop by wrapping it in a closure context that is immediatly called.
The next step is to remove all obvious objects allocations that happen inside our loop. This means we need to remove all the strings ("120" is an object allocation) and all the numbers.
One of the great things about closures is that their execution context is available in their children, this means we can place the strings and numbers of our loop in vars in the long-lived closure context instead, making them live between our loop function calls.
(function () {
  let count = 0;
  const limit = 120;
  const lastMark = "120";
  const firstMark = "0";
  // ^ all vars go here
  function fastest() {
    window.requestAnimationFrame(fastest);
    count += 1;
    if(count === limit) {
      performance.mark(lastMark);
    }
  }
  // ^ when the fastest() context finishes there
  // are no obvious object allocations to free
  performance.mark(firstMark);
  fastest();
})();
// setTimeout remains the same, this is just for performance measure
window.setTimeout(function() {
  performance.measure("120frames", "0", "120");
  const totalTime = performance.getEntriesByType("measure")[0].duration;
  console.log("120 frames in: " + totalTime);
}, 3000);
A speed-freak nighmare is a control-junkie best dream
That code above produces the string "120 frames in: 1990.69". This is great, it says that our measures were taken before the 16.7ms frame time has passed.
Lets look at the performance tab:
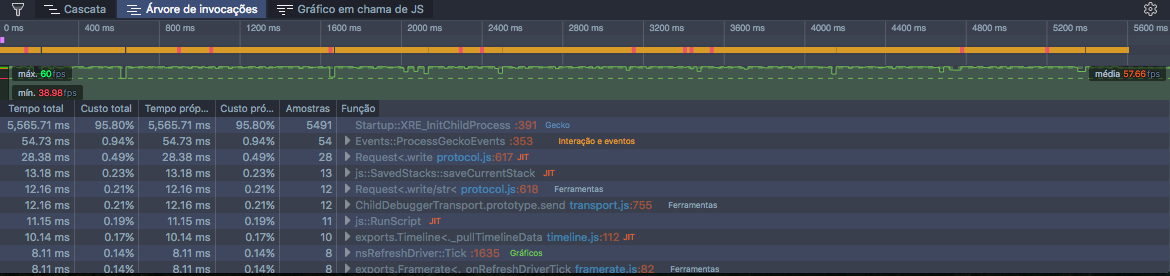
Note that the Nursery is completely gone from our call-stack. There are still some red dots that mostly refer to the Cycle Collector (from here on, just "CC") taking control of the code.
The CC does a simple job: it tracks cycles in the code.
A cycle happens when objects refer to each other in a way that their reference count never becomes zero. This can trick the GC to never collect them and forces the need to have a cycle counter running through the code once in a while.
The CC is a tricky beast, it does not allow anything else to run while it is running. Our JavaScript stops executing (you can validate this by increasing the zoom on the developer tools waterfall when a CC action occurs).
Fortunately this is not hurting the performance that much and each frame gets rendered bellow their time by the browser. I was starting to have some chills with the idea of having to frame limit the render loop to ensure a constant frame rate.
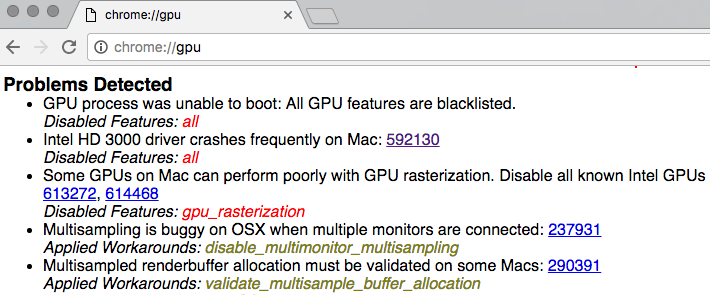
Thankfully this Intel HD3000 is still good for Nothing at all :)
Thanks Raquel Foster for reading this blog and motivating me to write this follow-up on React-Redux-Canvas.